LOG-MANAGER
Application performance profile viewer
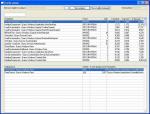
Fri, 2010-01-15 16:16 — StefanThis profiler identifies performancebottlenecks in your application by analysing the logfile you create with the log-manager.  Profiler
Memoryleak inspector
Thu, 2010-01-07 10:36 — StefanIdentifies possible memory leaks and their source by extracting those lines from logmanager output that point at created objects that are not deleted later on or allocated space that is not (fully) deallocated.
This analyser goes a bit further than http://www.oehive.org/node/846 and can handle OE 10.2A extra's
4GLTrace LOG-MANAGER Reporter
Tue, 2007-03-13 14:14 — timk519Reads output from a LOG-MANAGER:LOG-ENTRY-TYPE = "4GLTRACE:4" and reports the line number, date, time, statement elapsed time, total elapsed time, nesting level, action, action adjective, and remaining data in a columnar format
